Plot one or more variables from one or more Dlfs. Each variable is plotted in a separate subplot.
plot_dlf.RdPlot one or more variables from one or more Dlfs. Each variable is plotted in a separate subplot.
Usage
plot_dlf(
  dlfs,
  x_var,
  y_vars,
  type = "points",
  mode = "auto",
  title_suffix = "",
  group_col = "sim",
  x_label = NULL,
  legend_label = NULL
)
Arguments
- dlfs
Either a list of Dlf or a single Dlf. If a list with of components, the names are used for the legend.
- x_var
Name of variable for x axis
- y_vars
Either a list of variables to plot, or a single variable
- type
Either a string defining the type of plot to produce OR a single parameter function returning a ggplot2 object.
If a string, the the following types are supported * "bar" * "points" * "lines" Types cannot be abbreviated, but they can be combined as in type="barpoints" The types can be separated by a non-type string for readability as in type="bar + lines + points"
If a function, then it is passed a ggplot2 object and it should add a geom to the object and return it. For example, type=function(gg) gg + geom_point()
- mode
One of 'auto', 'single', 'grouped', 'list'. Default is 'auto'. If 'auto' try to guess the mode. If 'single' assume dlfs is a single dlf without a grouping variable If 'grouped' assume dlfs is a single dlf with a grouping variable. The grouping variable is the value of group_col If 'list' assume dlfs is a named list of dlfs without grouping variables. The names are used for grouping.
- title_suffix
A string that is appended to the title of all subplots
- group_col
Name of column to use for grouping. Ignored if mode is not 'grouped' or 'auto'#'
- x_label
Label to use for x axis
- legend_label
Label to use for legend
Value
A ggplot2 object. If y_vars is a single variable then the plot can be themed and further data added. If y_vars is a list of more than on variable, it is not possible to add further data to it.
Examples
data_dir <- system.file("extdata", package="daisyrVis")
path <- file.path(data_dir, "annual/Annual-FN")
dlfs <- read_dlf(path)
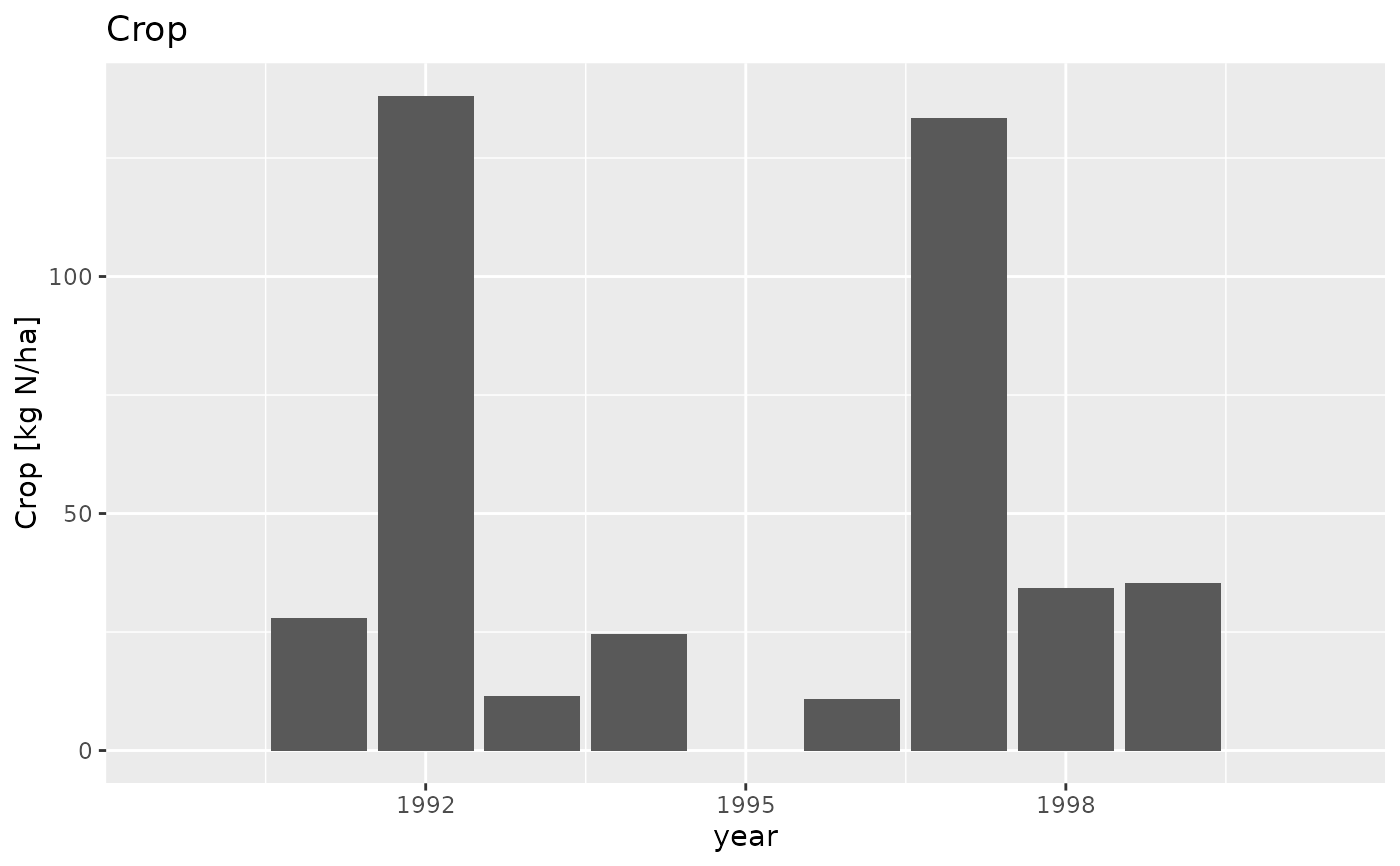
# Plot using a string for type
plot_dlf(dlfs[[1]], "year", "Crop", "bar")
 # Same plot with a function for type
geom <- function(gg) { gg + ggplot2::geom_col(position="dodge") }
plot_dlf(dlfs[[1]], "year", "Crop", geom)
#> Error in geom(gg): could not find function "geom"
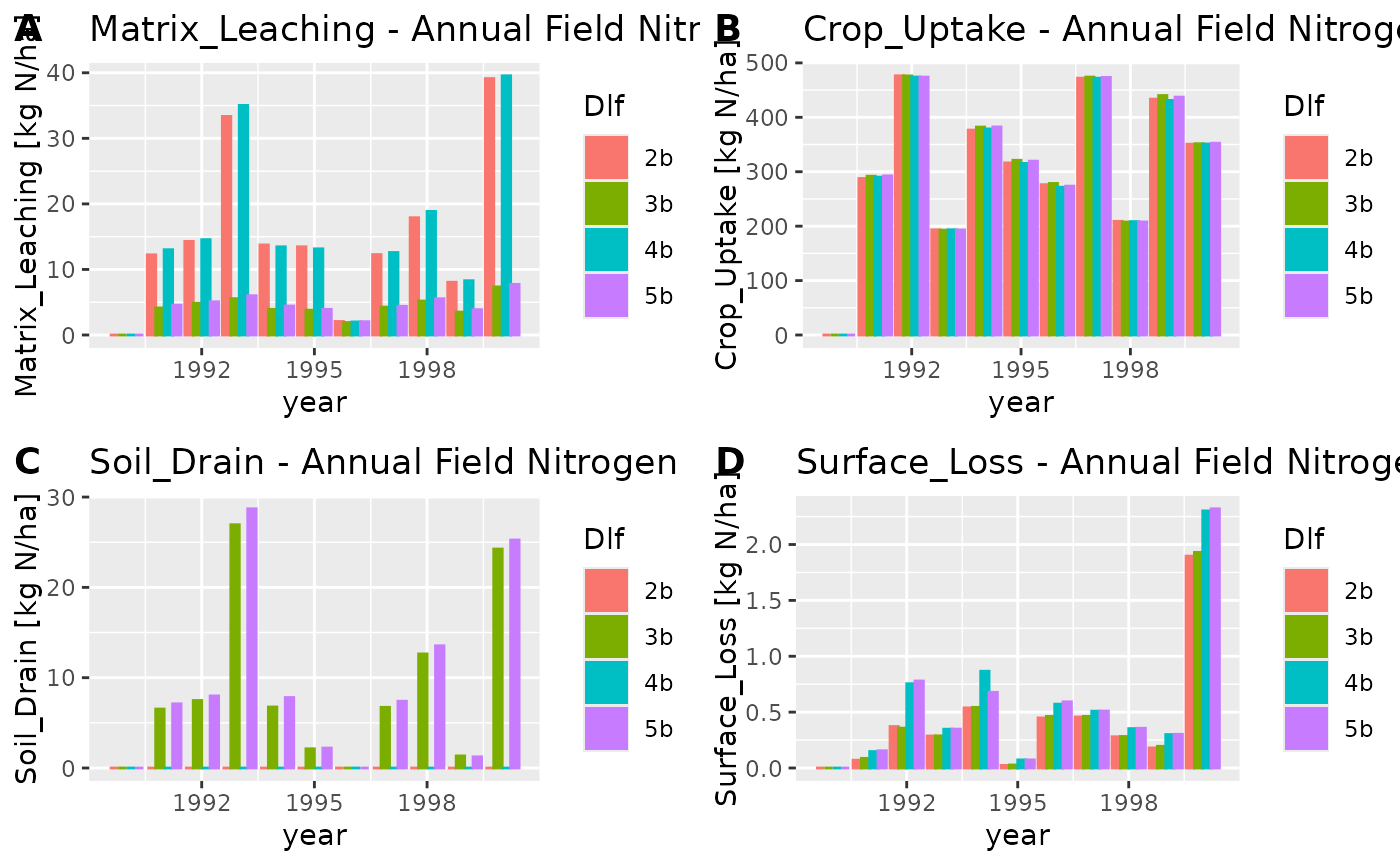
# A plot with four variables
dlfs <- strip_common_prefix_from_names(dlfs)
vars <- c("Matrix_Leaching", "Crop_Uptake", "Soil_Drain", "Surface_Loss")
plot_dlf(dlfs, "year", vars, "bar", title_suffix=" - Annual Field Nitrogen")
# Same plot with a function for type
geom <- function(gg) { gg + ggplot2::geom_col(position="dodge") }
plot_dlf(dlfs[[1]], "year", "Crop", geom)
#> Error in geom(gg): could not find function "geom"
# A plot with four variables
dlfs <- strip_common_prefix_from_names(dlfs)
vars <- c("Matrix_Leaching", "Crop_Uptake", "Soil_Drain", "Surface_Loss")
plot_dlf(dlfs, "year", vars, "bar", title_suffix=" - Annual Field Nitrogen")