Plot Dlf object with mass balance calculation in a control chart
plot_mass_balance.RdPlot Dlf object with mass balance calculation in a control chart
Examples
data_dir <- system.file("extdata", package="daisyrVis")
path <- file.path(data_dir, "hourly/P2D-Daily-Soil_Chemical_110cm.dlf")
dlf <- read_dlf(path)
input <- c("In_Matrix", "In_Biopores", "External", "Transform", "Tillage")
output <- c("Decompose", "Leak_Matrix", "Leak_Biopores", "Drain_Soil",
"Drain_Biopores", "Uptake")
content <- c("Content", "Biopores")
mb <- mass_balance(dlf, input, output, content)
mb <- daisy_time_to_timestamp(mb)
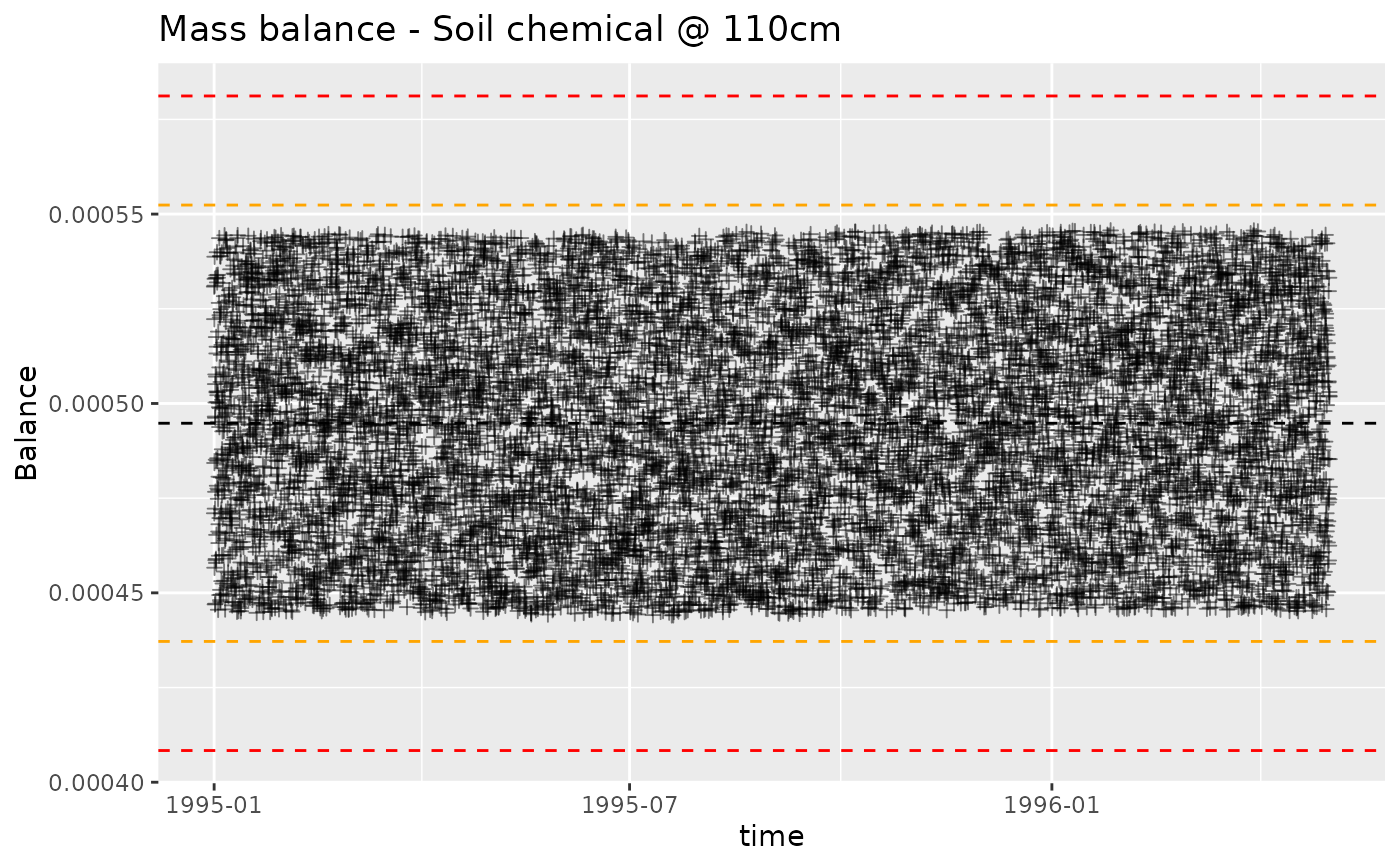
plot_mass_balance(mb, "time", " - Soil chemical @ 110cm")